
After Poofah directed me to the thread where Celestalon explains how damage is calculated (Warcraft Pets) I decided to find out some exact probabilities for Burn. Before proceeding, here is what Celestalon explained:
“For battle pet abilities with damage variance, here is an example of how it works:
Let’s say your ability inflicts 200 to 440. The average would be 320.
We calculate our roll size as (440 – 200) / 2 = 120.
We then roll 120 three times and take the highest value. Our rolls are 14, 56, and 101, so we take 101. This is to give more noticable results and keep us away from the average.
Now we determine if the roll is added to or subtracted from the average.
Your base chance for a positive result is 50%.
If your hit is above 100%, your chance for a positive result is 50% + (Hit – 100) (EDIT: Fixed this formula). So, you always get a positive result at 150% hit and higher.
Critical strikes are ALWAYS positive.
A positive result would be 320 + 101 = 421
A critical strike would be (320 + 101) * 1.5 = 631
Otherwise the result would be 320 – 101 = 219”
Knowing this, it is possible to compute the exact probabilities for each number in the damage range. You just have to look at the triplets composed of the three rolls. Lets look at a hypothetical example where the roll size is 3. We would have 27 (3^3) different triplets:
111
222,211,121,112,221,212,122
333,332,323,233,331,313,133,322,232,223,311,131,113,321,312,231,213,132,123
A result of 111 means that the maximum roll is 1, a result of 221 or 112 means that the maximum roll is 2, a roll of 132 means that the maximum roll is 3.
The probability of the maximum roll being 1 is 1/27, 2 is 7/27, 3 is 19/27. This maximum roll is the number that would be added or subtracted from the average. So if my midpoint (average) was 5 then I would have a 1/27 probability of doing 6 damage (5+1), an 7/27 probability of doing 7 damage (5+2) and a 19/27 probability of doing 8 damage (5+3). This is only for positive (high) damages. The negative (low) damage distribution would be the symmetric about the midpoint. So really the probability of doing 8 damage would be 19/54, and the probability of doing 2 (5-3) damage would also be 19/54 (half of 19/27).
Using this method of calculating the maximum roll I computed the probabilities for individual damage values of Burn. Here’s an outline of the process:
– find range, midpoint, roll size
– find triplets
– calculate the probabilities of each maximum roll
– add this roll to the midpoint, giving the amount of damage, of which the probability is known
– this is the only the positive end of the damage, but the probabilities are symmetric around the midpoint so the negative damage probabilities can be found by a transposition of the data
– divide the probabilities by 2 since the total probability is now 2 rather than 1 (the symmetry I mentioned above)
There was one gray area having to do with the midpoint. In the given example the range is even so both the midpoint and roll size are integers, but in the case of Burn they are not. The midpoint of the damage range is 293.5. I could either round the midpoint up and the roll size down or vice versa. I chose the latter, making the “midpoint” 293 and the roll size 59. The alternative would have been to make the “midpoint” 294 and the roll size 58, but this would exclude 294 from the damage range.
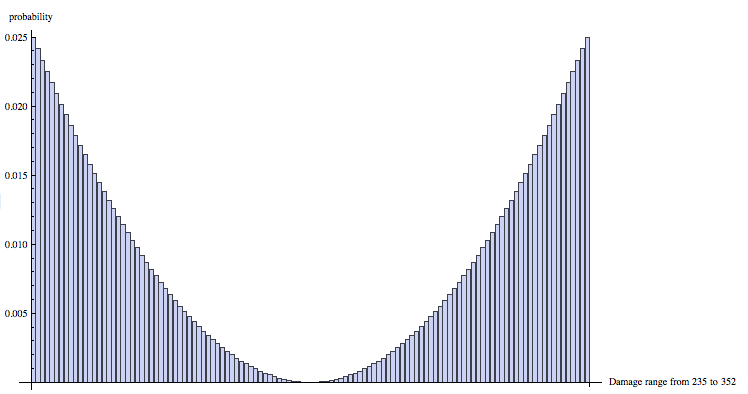
I decided to use this method on Burn from an S/S Fiendish Imp, which hits from 235 to 352 damage. Here is a chart with all of the probabilities, the cumulative probability and its complement. The values can be read as the damage, the probability of getting exactly that value, the probability of getting at most that damage, then the probability of getting more than that damage. For example, look below at the column for 242 damage. The probability that I do 242 damage is 0.01937 (1.94%), the probability that I do 235 – 242 damage is 0.17705 (17.71%) and the probability of doing 243-352 damage is 0.82294 (82.29%). Perhaps a better way of stating it would be to say If your opponent’s pet has 243 health then you have a 82.29% of killing it with a Burn from an S/S imp.
The mean of the positive (high hitting) values is 337.7.
The mean of the negative (low hitting) values is 249.3.
Both had a standard deviation of 11.4.
Here is a bar chart of the probabilities. As much as I love Mathematica for computation I suck at making it look good. After many attempts at labeling the bars I gave up. I’ll just say that each bar represents one damage value (from 235 to 352) and the height is the probability of getting that value.
Here’s the code I used in Mathematica 7:
min = 235;
max = 352;
range = max – min;
midpoint = N[(min + max)/2];
highmid = midpoint + 0.5; (*never used below*)
lowmid = midpoint – 0.5; (*never used below*)
rollsize = N[range/2] + 0.5;
index = Table[i + (min – 1), {i, range + 1}];
maxlist = Table[0, {rollsize}];
maxlist[[1]] = 1;
For[q = 2, q <= rollsize, q++,
maxlist[[q]] = maxlist[[q - 1]] + 6 (q - 1)]
upperpdf = Table[0, {rollsize}];
nsupperpdf = Table[0, {rollsize}];
outcomes = rollsize^3;
For[p = 1, p <= rollsize, p++,
{
upperpdf[[p]] = (N[maxlist[[p]]/outcomes])/2;
nsupperpdf[[p]] = (N[maxlist[[p]]/outcomes]); (*ns = nonscaled*)
}
]
lowerpdf = Reverse[upperpdf];
nslowerpdf = Reverse[nsupperpdf];
pdf = Join[lowerpdf, upperpdf];
nspdf = Join[nslowerpdf, nsupperpdf];
cdf = Accumulate[pdf];
cdfcomp = Table[0, {range + 1}];
For[u = 1, u <= range + 1, u++, cdfcomp[[u]] = 1 - cdf[[u]]];
lowermean = 0;
For[L = 1, L <= rollsize, L++,
lowermean = lowermean + index[[L]]*nspdf[[L]]];
uppermean = 0;
For[t = 1, t <= rollsize, t++,
uppermean = uppermean + index[[t + rollsize]]*nspdf[[t + rollsize]]];
lowerXsquared = 0;
For[s = 1, s <= rollsize, s++,
lowerXsquared = lowerXsquared + (index[[s]])^2*nspdf[[s]]];
upperXsquared = 0;
For[r = 1, r <= rollsize, r++,
upperXsquared =
upperXsquared + (index[[r + rollsize]])^2*nspdf[[r + rollsize]]];
var = lowerXsquared - lowermean^2;
var = upperXsquared - uppermean^2; (*reduntant but used as a check*)
std = Sqrt[var];
indexH = Prepend[index, "x"];
pdfH = Prepend[pdf, "p(X=x)"];
cdfH = Prepend[cdf, "F(x)"];
cdfcompH = Prepend[cdfcomp, "1 - F(x)"];
dataH = {indexH, pdfH, cdfH, cdfcompH};
dataTH = Transpose[dataH];
BarChart[pdf,
AxesLabel -> {“Damage range from 235 to 352”, “probability”}]
grid = Grid[dataTH, Frame -> All,
ItemStyle -> Directive[FontSize -> 20, Black]]
Print[“range = “, range];
Print[“rollsize = “, rollsize];
Print[“midpoint = “, midpoint];
Print[“Upper Mean = “, uppermean];
Print[“Lower Mean = “, lowermean];
Print[“variance = “, var];
Print[“standard deviation = “, std];
———————————–end of code
Obviously I’m not a pro coder, but the job got done :P. I think that it’s all pretty straight forward with the exception of how I came up with the triplets that lead to a specific roll. It turns out that there’s a nifty pattern there. You can start to see it in the example of triplets that I gave above:
111 (one case where one is the max roll)
222,211,121,112,221,212,122 (seven cases where two is the max roll)
333,332,323,233,331,313,133,322,232,223,311,131,113,321,312,231,213,132,123 (19 cases)
If you list the number of times each number is the maximum it gives the sequence
1, 7, 19, 37, 61, 91, 127,…
1 = 1
7 = 1 + 6•1
19 = 7 + 6•2
37 = 19 + 6•3
61 = 37 + 6•4
91 = 61 + 6•5
127 = 91 + 6•6
…
37 would be the number of triplets where 4 is the max roll, 61 would be the number of times that 5 is the max roll, and so on.
Once I saw this it was easier to create the list maxcount recursively rather than create a list of triplets and check them one by one. It was very hard on the comp when I tried to do it this way initially.
 Latest Tweets